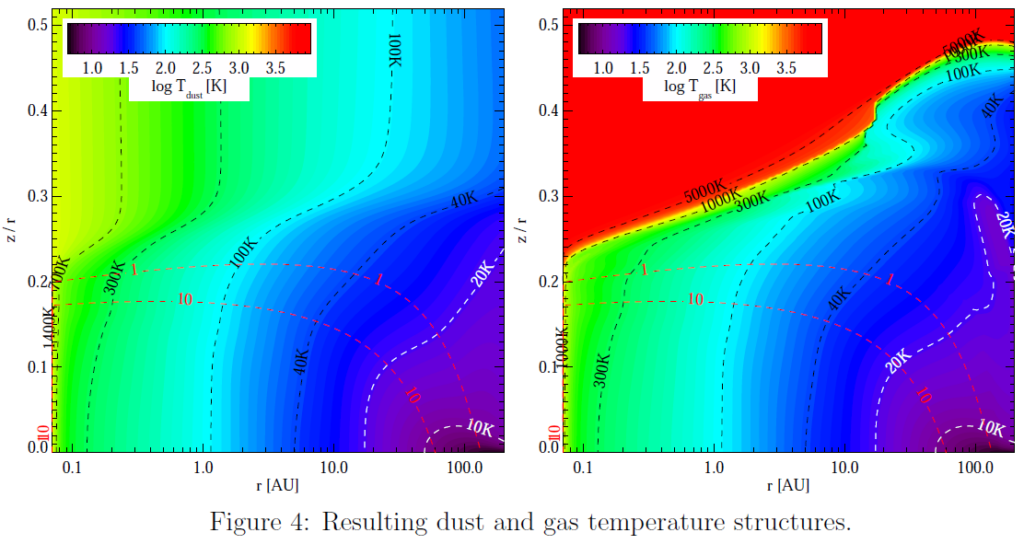
The resulting dust and gas temperatures in this model are shown in Fig. 4. Ignore the red regions on the r.h.s. of Fig. 4, the gas densities are so low there, that these regions are completely irrelevant for both continuum and line emission (the X-rays cause an HII region here). Important are the warm disc surface layers below (down to about Aν = 1) where typically Tgas > Tdust. This is key to produce the emission lines as observed (negative temperature gradients would result in absorption lines!), and it is important that the temperature contrast between dust and gas is modest to fit the observed line flux magnitudes. In contrast, Tgas = Tdust can safely be assumed in the midplane regions (Aν > 10), where the densities are large (inelastic dust-gas collisions are frequent) and where the UV and X-ray radiation fields, which cause the temperature differences, cannot penetrate into.
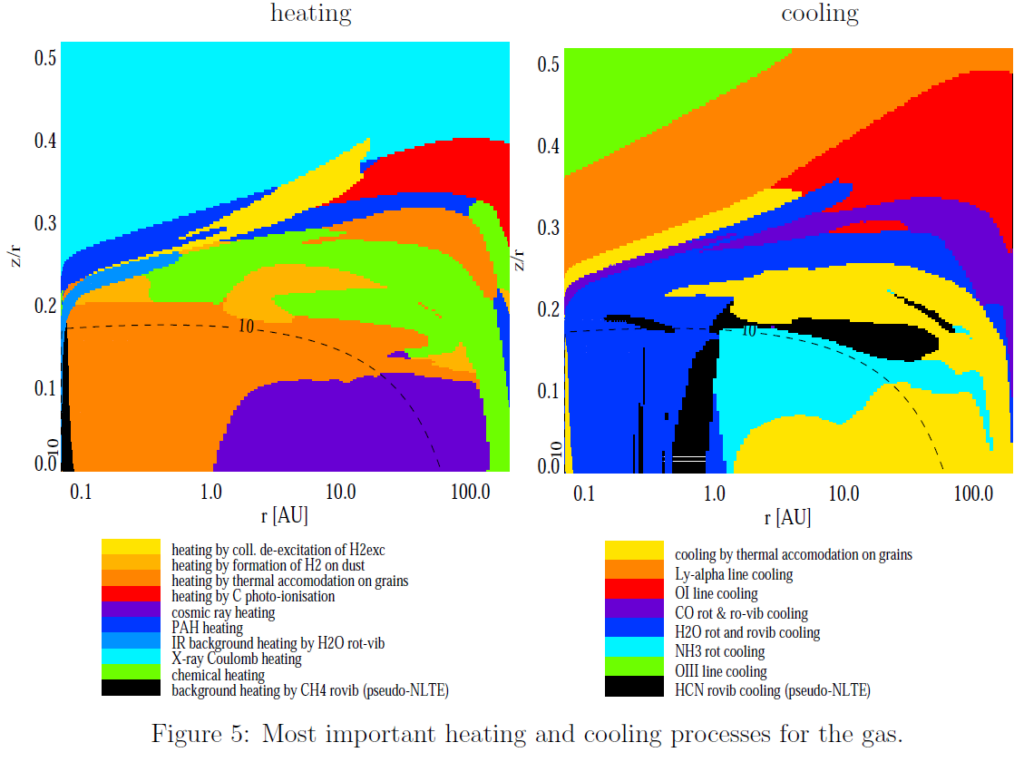
Figure 5 shows the leading heating and cooling processes. Particularly important for the line formation regions are PAH-heating, exothermic chemical reactions, several follow-up heating processes after photo-excitation or photo-dissociation of H2, and neutral carbon ionization. The most important cooling processes are thermal accommodation, H2O ro-vibrational lines, CO ro-vibrational lines, [OI] 63 μm and [CII] 157 μm line emission. It is important to have ro-vibrational lines, not only rotational, actually for both cooling and heating.
Return to:
1. Spectral Energy Distribution
2. Disc Shape and Dust Settling
Go on with:
4. Chemical Structure
5. Predicted Continuum Observations
6. Predicted Line Observations